CoVid-19: Making Sense of the Numbers
- Details
- Written by Dave Pollard
 Click to enlarge image
This is the 12th in a series of articles on CoVid-19. I am not a medical expert, but have worked with epidemiologists and have some expertise in research, data analysis and statistics. I am producing these articles in the belief that reasonably researched writing on this topic can’t help but be an improvement over the firehose of misinformation that represents far too much of what is being presented on this topic in social (and some other) media.
We’re about 7 months into this pandemic, and we’re still, despite what some politicians are saying, in wave one. There have been surges in various places but that’s because the disease has never really been under control. If there’s a wave two, it will be when it morphs into a new, mutated virus, that might be much more or much less lethal than the variants we have seen thus far, and might, like the 1918 wave two, affect a completely different demographic than the mainly-senior victims of wave one.
So taking the summary chart above, line by line, here’s where would seem to stand now:
- IHME has started reporting on data in the seven WHO global ‘regions’ shown in the columns above, with their populations, in millions, shown in row 1 (I have broken out Canada because it’s where I live and because its situation is very different from the US situation).
- Row 2 shows reported deaths to date as they soar past the one million mark. For the past five months now daily reported deaths have moved in a very narrow range between 4,000 and 6,000, and there is no evidence that it will vary in the foreseeable future. 5,000 deaths a day is a million reported deaths every six months between now and when an effective vaccine is globally administered. Actual CoVid-19 deaths, according to many “excess deaths” studies, continue to be 50% or more above reported figures. Note that the Americas and Europe (which includes the former USSR nations) follow the Pareto ratio — they have 80% of the reported global deaths with 20% of the world’s population. This raises lots of questions for which we still have no answers: Why, for example, when Nigeria has a larger and more concentrated population than Brasil, and a similar demographic, does it have only 1,000 CoVid-19 deaths while Brasil has nearly 150,000?
- Row 3 shows the cumulative reported deaths per million people which shows, for reasons we can to some extent only guess at, that the four regions with 80% of the world’s people have less than a tenth the per capita deaths of the Americas and Europe. Limited international mobility, a much lower average age (shown in row 18), stricter lockdowns, and a more government-compliant culture, account for some of this difference, but not all of it. Will their turn come, or are they just less susceptible?
- Row 4 shows the 7-day moving average of reported daily deaths as of this week. It’s rising in Canada and Europe, falling in Latin America, and flat in the US, but on balance still tracking the same global average as it has since May.
- Row 5 shows the current rate of daily deaths per million people. IHME believes that until this rate reaches eight daily deaths/million in any particular city, country or area, no significant additional restrictions will be imposed. I think that’s an unduly pessimistic assumption, even with pandemic fatigue; more on that below.
- Row 6 shows the % of the population that is estimated to have been infected (including asymptomatically), the proportion that is presumably, hopefully, immune to reinfection, at least for a while. In some areas of the Americas (eg New York) and Europe (parts of Italy and Spain) it’s as high as 25% but still nowhere near herd immunity levels. (Although in some parts of the US it’s apparently nearing “herd mentality” levels.) New infections in NYS have been remarkably low for months, but are now starting to rise again, so we should soon have some sense of whether actual infections-to-date are much higher than current best guesses, or not. Both WHO and IHME are now basing infection assumptions on a 0.65-0.70% IFR.
- Row 7 shows current reduction in traffic to businesses, workplaces, and public areas versus previous years’ “normal” levels. When infections were at their worst in late March-April, some of these numbers were closer to -80 to -90%.
- Row 8 shows commensurately the increase in the use of masks as less social distancing is done in most areas. On average these percentages have doubled over the past couple of months; more details are in the map below.
- Row 9 shows the current “positivity” rate (% of tests with positive readings). In some areas doing little testing, these are meaningless, but in Canada and parts of Europe where they have recently doubled or tripled from very low levels where the pandemic seemed to be sufficiently under control that testing & tracing programs would work, this might soon no longer be the case. In the US & Latin America there’s hardly any point in having such programs, since with one of every 200 citizens currently infectious, it would be impossible to trace and isolate everyone in contact with the infected, even with a high level of cooperation, which is often lacking due to shaming and privacy fears.
- Row 10 shows the % of the population that is estimated to have been infected in the last 14 days ie the percentage that is currently infectious. Note that because of utterly inadequate testing in most jurisdictions this % is between two and ten times higher than reported cases over the past 14 days.
- Row 11 shows the number of tests done to date in each region, in millions.
- Row 12 shows the % of the population that has been tested, assuming about 20% of the tests given are repeat tests.
- Row 13 shows that just over 150 million people worldwide are estimated to have been infected, just about 2% of the world’s people, of whom about one in ten is still infectious today. That compares to just 34 million reported cases globally. The data suggests that 80% of cases were never identified and reported, and even with increased testing today less than half of new cases in most areas are identified and reported. So while trends in reported daily cases are important, the raw numbers are so understated as to be close to meaningless.
- Row 14 shows IHME’s projected deaths over the next three months (by December 31), a 150% increase to 2.5 million compared to the current million. Their assumption is that until reported daily deaths reach 8 per million people the toll will be allowed to rise without new restrictions. But as the charts below suggest, my guess is that action is often taken when daily deaths reach 3 per million people, and the very fact that people are aware of increases in cases and deaths causes behaviour changes that prevent cases running out of control the way they did in March when we didn’t know any better. My estimate of 266 thousand American and 10 thousand Canadian deaths by that date compares to IHME’s much more pessimistic estimates of 372 thousand and 16 thousand deaths respectively. We’ll see who’s right. IHME was previously estimating 415 thousand US deaths by December 31, so I think they’re starting to get closer to an accurate estimate. Though much could change by then.
- Row 15 shows IHME’s projected daily reported deaths on December 31. Compared to the prevailing 4,000-6,000 daily deaths since May, I think their forecast of 33,000 daily deaths by December 31 is off the mark. Pandemic fatigue and incompetent governments or not, I just don’t think the world’s citizens will tolerate that kind of death toll. Even in Brasil, whose unpopular and unhinged leader denies the pandemic is a serious matter, far more than half the population say they always wear masks outside home. I’m prepared to admit if I am proved wrong, but I just don’t see it getting six times as bad as it is now.
- Row 16 shows the projections in row 15 computed as daily reported deaths per million people. Contrast that to the current situation in row 5.
- Row 17 shows the % of the population that will be infected and hence hopefully immune as of December 31 if IHME’s projections are correct. Contrast that to the current situation in row 6.
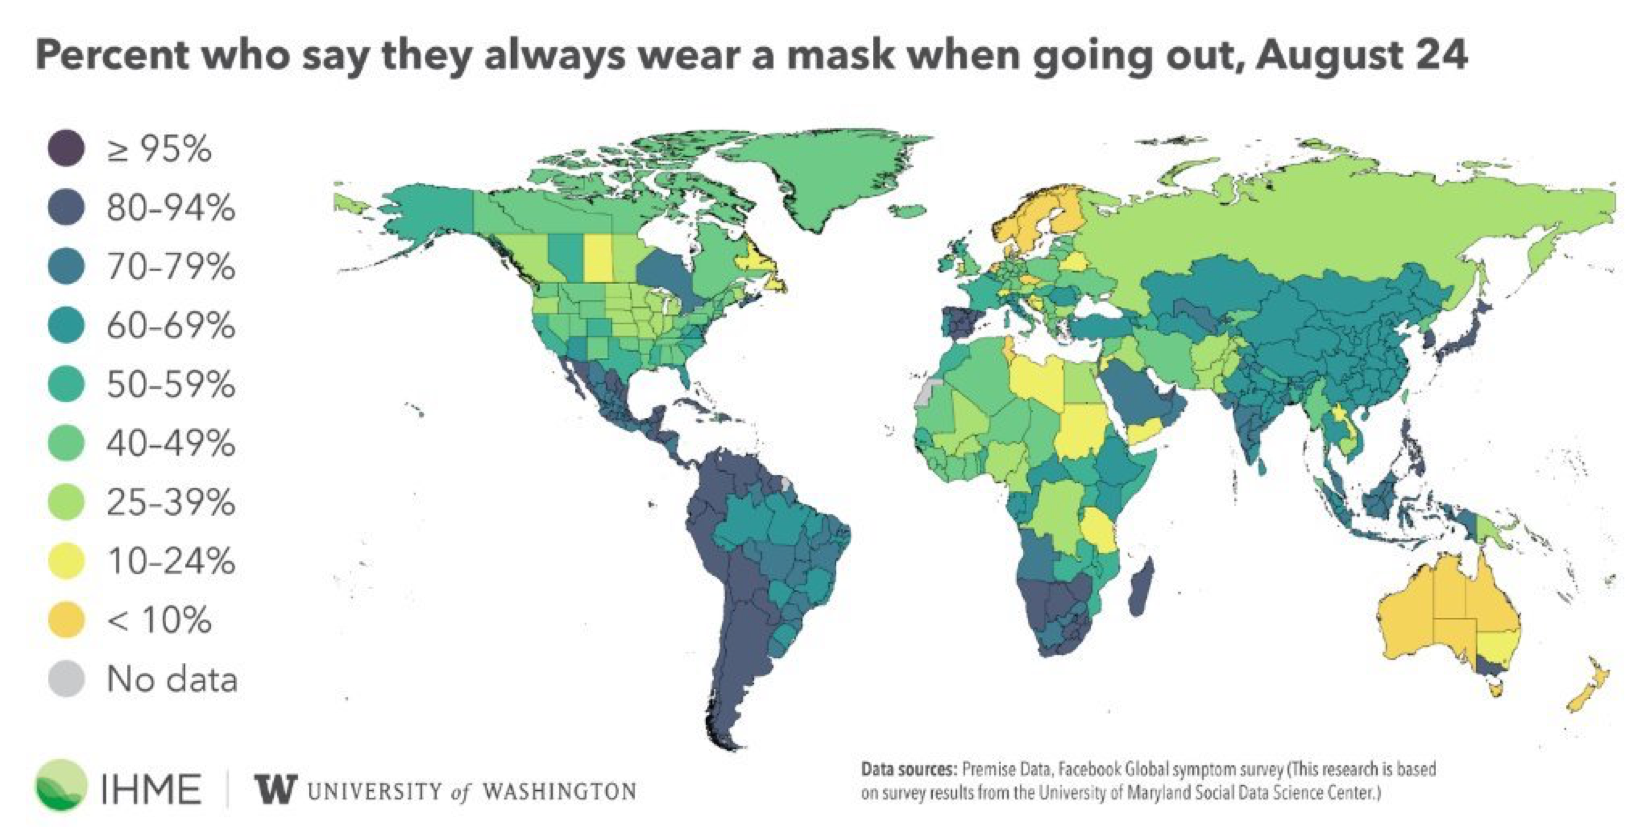
Only in the US is self-reported mask use, in some areas, declining. As cases spiked in Victoria state even Australians are starting to use them. In almost every area, increased mask use in an area follows a spike in cases and deaths in that area. But in most of the world, they’re keeping them on even as cases and deaths ease.
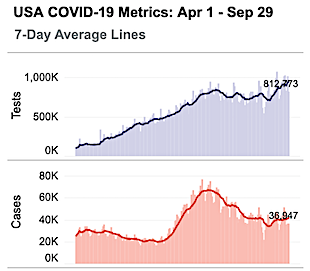
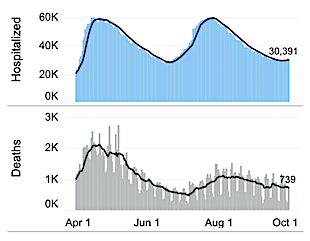
The above data, from the CoVid Tracking Project, shows what I think we’re likely to see in much of the world as the pandemic continues — a general flat-to-slowly-downward trend in actual cases (even as reported cases trend flat-to-upwards due to more testing), and in hospitalizations and deaths, but with recurring upswings in different areas due to a combination of complacency, relaxing standards prematurely, seasonal variations (as we move indoors for the winter and face regular influenza as well as CoVid-19), and just plain bad luck. There’s no reason to believe these trends won’t continue for at least another year or until an effective vaccine is available globally. Prepare for a long, thick, and irregularly shaped tail to this pandemic; it’s happened before.
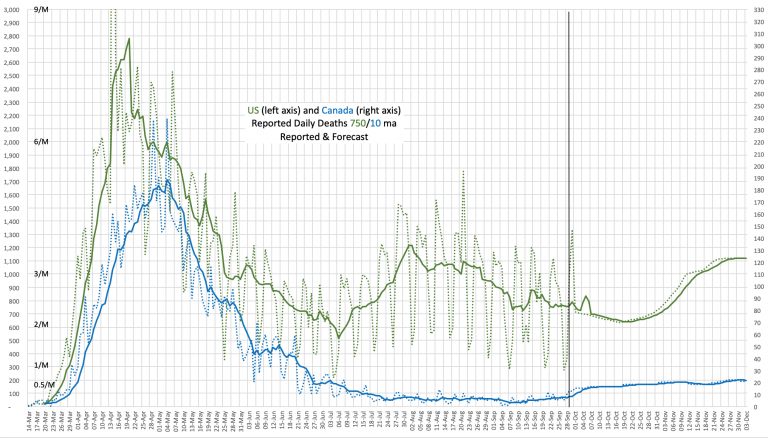
This chart shows the difference between a pandemic under control (Canada, blue) and a pandemic out of control (US, green). The difference is due to a combination of good luck and good management. Note that the Canadian data uses the right scale, which is 1/9 of the left scale, the same as the relative population proportions. Canada tried to flatten the curve, with more success than the US but not dramatically so. And then suddenly in June the curves diverged wildly to the point the daily deaths in Canada (under 10, ie 0.3/M/day) were as much as two orders of magnitude smaller than the US daily death rates (over 1,000, ie 3.0/M/day).
Because reported cases in the US are now flat at about 150/M/day, however, while reported cases in Canada have recently more than doubled from 13/M/day to 30/M/day, this enormous per-capita gap will likely narrow from 10:1 to closer to 3:1, with Canadian deaths doubling to 20/day (0.7/M/day) compared to a steady 750/day (2.3/M/day) in the US. The pandemic will remain out of control in the US, but may not stay in control in Canada. The IHME is forecasting a much worse situation by year-end, with US deaths quadrupling to 3,000/day (9/M/day) and Canadian deaths soaring by a factor of thirty to 300/day (8/M/day). I’d be very surprised if these alarmist predictions come to pass.
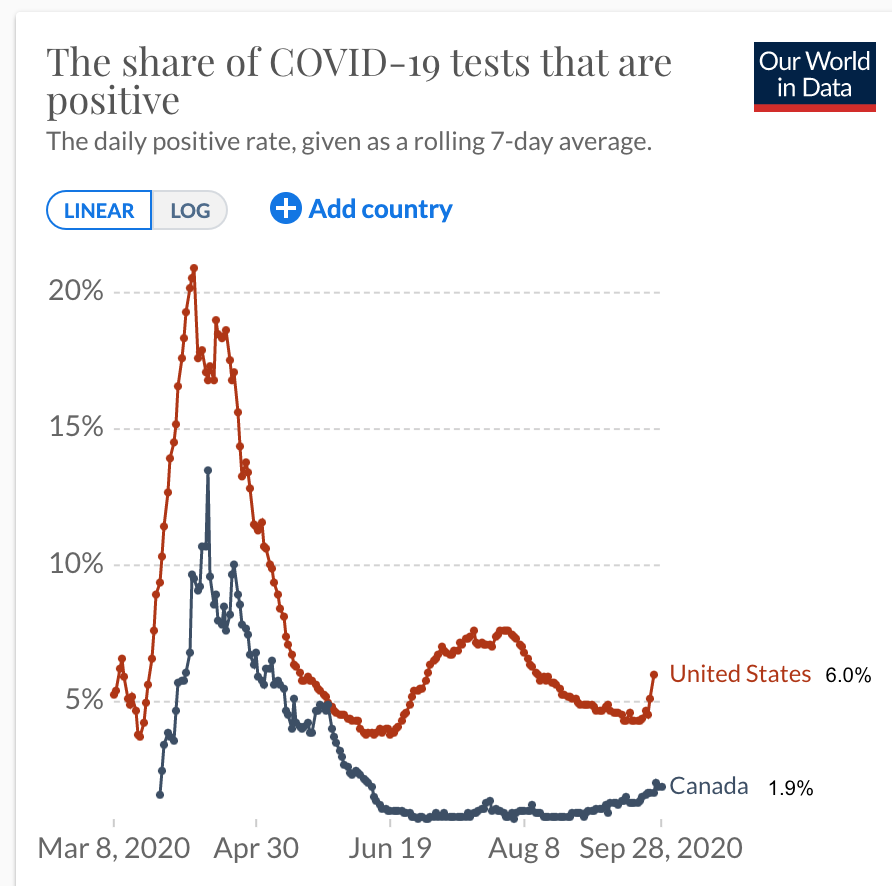
This chart, from Our World in Data, conveys a similar message — the per-capita death toll in the US, which has been 10x higher than Canada’s, is likely to move closer to 3:1 as the positivity rates converge. Still a large divergence, but worrisome for Canada’s situation, which is mirrored in several European countries where positivity rates have suddenly spiked above 5%. Testing and tracing just aren’t manageable when the positivity rate is more than about 3%, which translates into about 0.1% of the population being currently infectious, one out of every 1,000 people. Too many people to track.
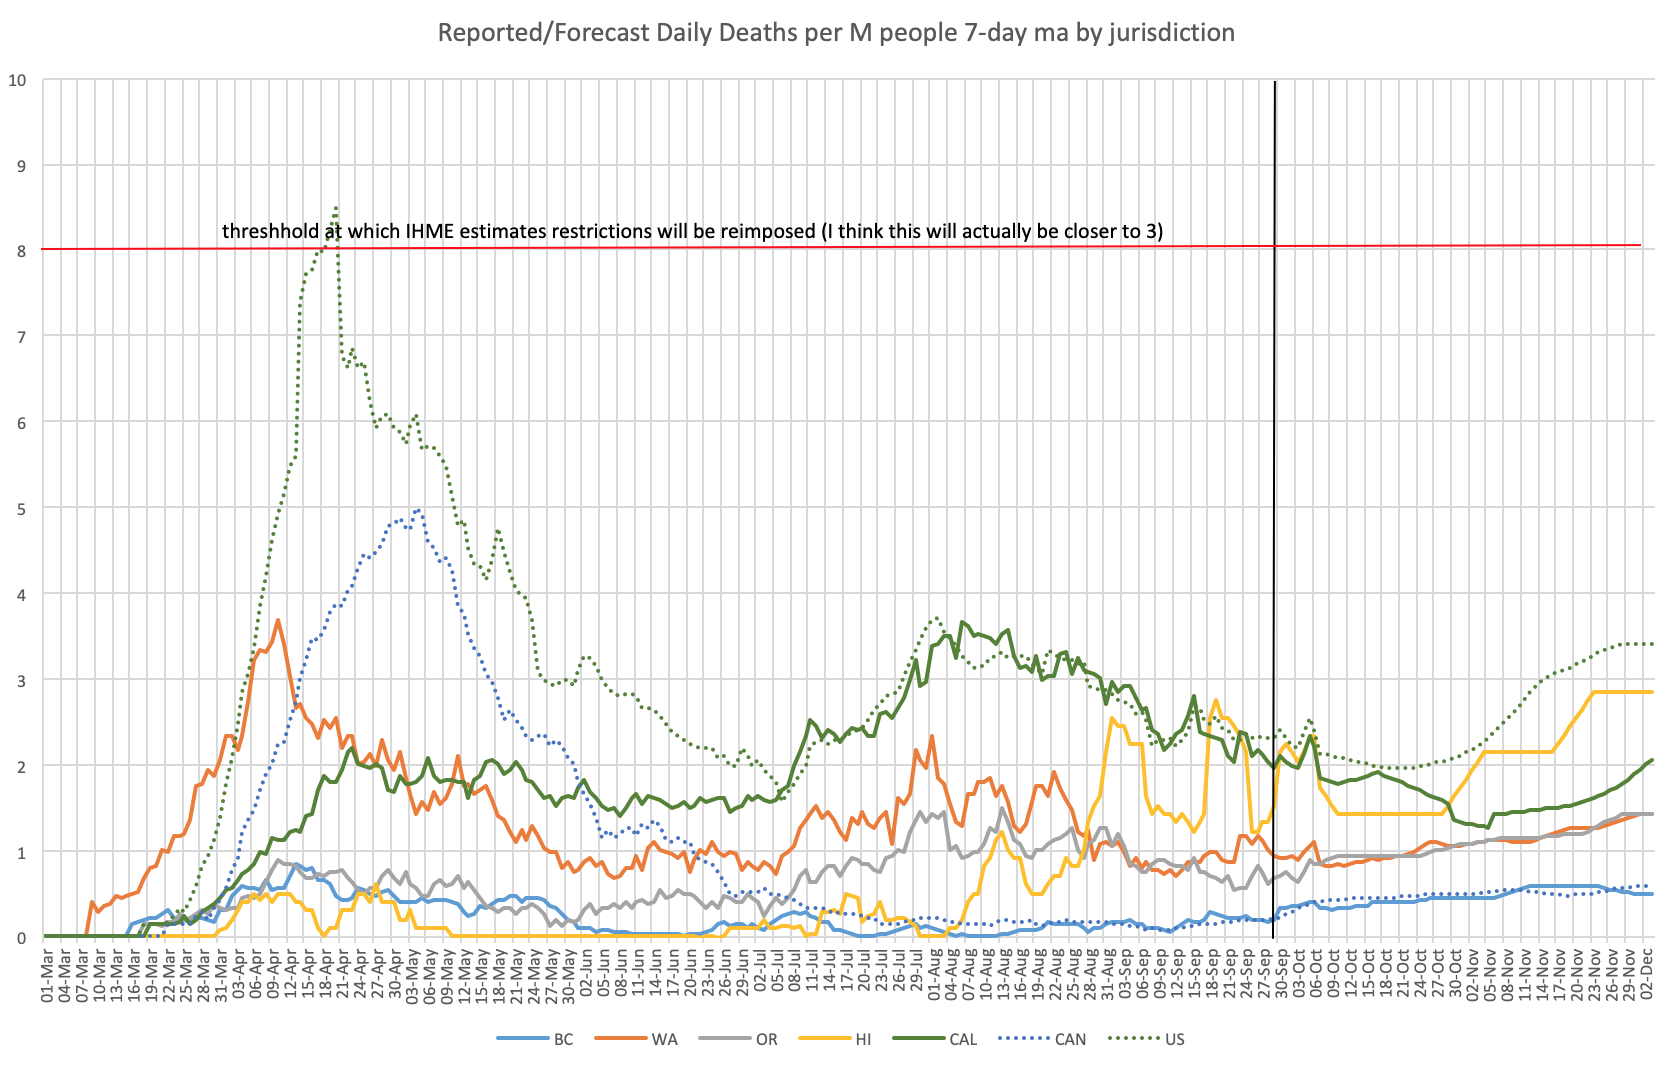
Here’s the first of three charts showing the situation on North America’s west coast. In each case these are reported deaths per million people per day. You can see when peak deaths hit each jurisdiction — Washington and BC first, then the east coast of the US, then Eastern Canada (the eastern states’/provinces’ infections came from Europe, and then worked their way west again), and much later California and Oregon, and just now Hawaii. The forecasts are mine, based on current reported case counts, adjusted IFRs, and behaviours after past case spikes. IHME is projecting these death counts to go off the chart in December (close to or over 10 deaths/M/day except in BC and Hawaii), with no action taken until rates cross the red line near the top of the chart. I don’t agree, but my track record to date hasn’t been any better than theirs.
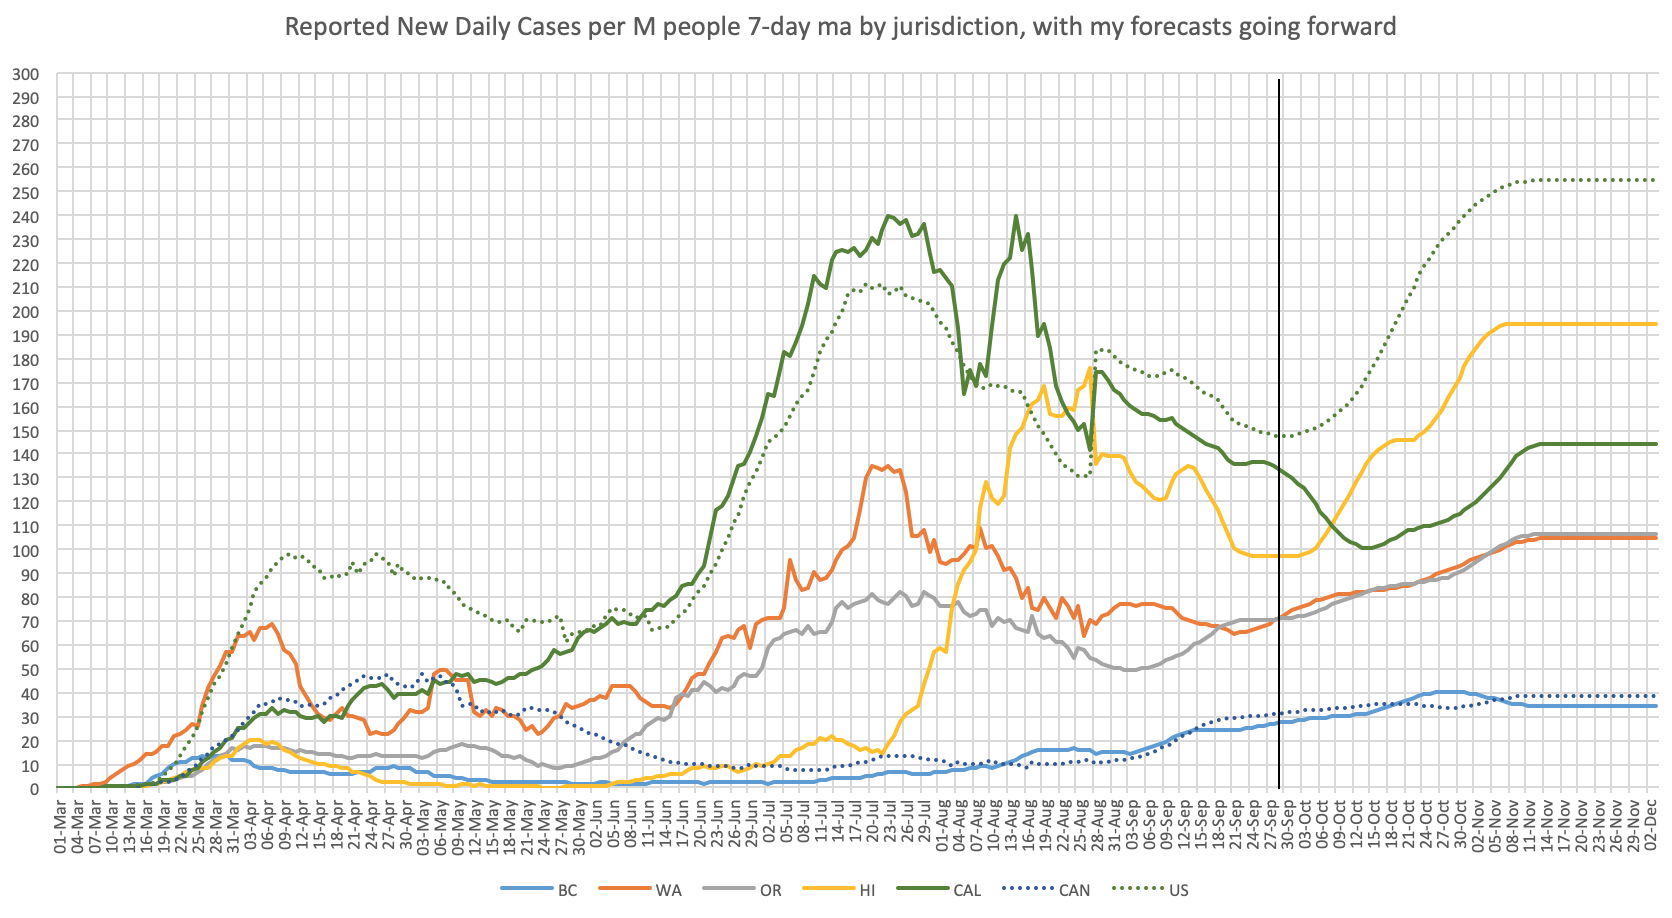

These two charts show, top, the reported cases per day per million people, and, below, IHMEs (with some minor adjustments by me) estimated actual cases per day per million people, based on “working backwards” from subsequently reported daily deaths. They tell very different stories. Peak reported cases in the US came in July, while in the Eastern US and in Washington state the actual case peak likely came back in March. Daily reported cases in all jurisdictions are now (end of September) at or near record highs, while in most jurisdictions estimated actualdaily cases are nowhere near their earlier peaks.
Again, the projections are mine, as IHME’s much more pessimistic forecasts have estimated cases soaring off the top of the charts by the end of December.
Long bumpy ride ahead. But all pandemics end, and few of them last for years. Barring a second wave that kills the young and healthy like the second wave did in 1918, or unexpected problems with vaccines, I’m guessing a year from now we should be back doing most of the things we could do last year, though there will likely be some new, permanent or semi-permanent inconveniences.
But don’t get too comfortable. The chances of additional pandemics are high, and we’re not taking any of the steps needed to reduce their likelihood. And we still have basically no idea what the virus has done to our bodies that will affect our health long-term.
And if you think pandemics are a major inconvenience, just wait ’til you see what ecological and climate collapse will do to our unsustainable lifestyles in the years ahead.
Credit

This work is licensed under a
Creative Commons License.
Source Here
Dave Pollard's chronicle of civilization's collapse, creative works and essays on our culture. A trail of crumbs, runes and exclamations along my path in search of a better way to live and make a living, and a better understanding of how the world really works.

Liked this article? Dive deeper into personal growth and wellness! Check out CrystalWind.ca for spiritual wisdom or explore AromaWorx.ca for natural well-being tips. Spread the positivity—share this with friends on their happiness journey!
Let’s Chat! Drop Your Thoughts Below! ![]()
Keep CrystalWind.ca free—your gift matters now!
Help us spread light today. Thank you, supporters!
![]()
Related Articles - Journey


Latest Articles


Dive into the Mystical World of the Crystal Wind Oracle Deck!
Get All the Enchanting Details Now!
NEW Expanded Boxed Edition!
Now with 58 Cards for Richer Wisdom!

Shatter Illusions – Gain Clarity Now!
Instant Access On:


Imagine a world of inspiration and healing, free for all—made possible by YOU!
Donate Now—Ignite the Magic at CrystalWind.ca!


Epilepsy - Finding A Cure
Your donation can make a difference!
Help us find a cure – donate now!
Unlock Your Light: Join Lightworkers Worldwide on CrystalWind.ca!
Call For Writers

Follow Us!
Featured This Month
Page:
Peridot: The Healer's Stone

Peridot has been used as a Power Stone for centuries. Peridot fosters emotio... Read more
Mabon Magic: Ideas For Fall Decoration And R…

Welcome (almost!) to Fall! We’re turning the Great Wheel once again, toward ... Read more


Crystals for Virgo

As the warmth of summer begins to soften into the crispness of autumn, the Sun... Read more


Sun in Virgo

An Overview of Sun Sign Characteristics for Virgo Virgo is guided by Mercur... Read more
Sweet Violet

Sweet Violet Faithfulness and modesty. “I will always be true to you.” Helps... Read more
Watermelon Tourmaline

Synonym: Rainbow Tourmaline The watermelon tourmaline is a rare variety t... Read more
Virgo Mythology

The Virgo Myth In all of constellation mythology, few legends are as misund... Read more

Mabon in Modern Times: Fresh Takes on the Au…

The Mabon season begins somewhere around the 21st-22nd of September and cont... Read more
The Vine: September 2nd - September 29th

The Autumnal Equinox ( Alban Elfed ) Celtic Symbol : The White Swan Read more